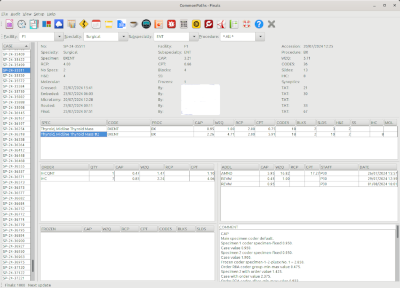
Multiple measurement systems
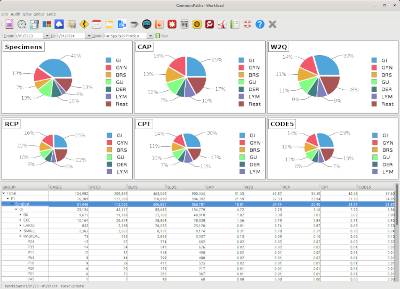
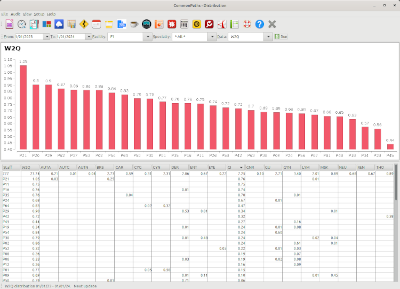
Measure workload by 4 different systems simultaneously, CAP-L4E, W2Q, RCP and CPT. The average value is calculated annually and used to assign workload prospectively on a daily basis.
A free and fully automated software for Anatomical Pathology
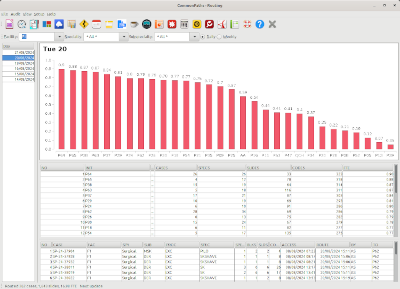
Analyze your total workload & workflow, grouped by facility, specialty, sub-specialty, procedure, pathologist, grossing room or histology station in any order, during any time period and in real-time.
Measure workload by 4 different systems simultaneously, CAP-L4E, W2Q, RCP and CPT. The average value is calculated annually and used to assign workload prospectively on a daily basis.
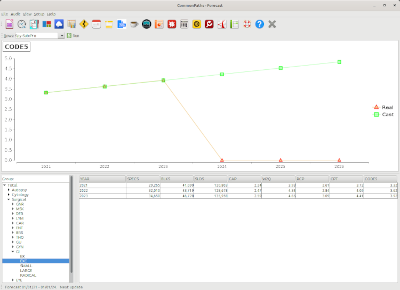
Review any case or specimen coding and make sure it is done correctly.
Generate daily, weekly, monthly, quarterly and annual reports on the fly from any date range you need. The data is stored indefinitely and available in real-time.
Any clinical activity documented in your AP system is automatically captured including frozen sections, internal consults, tumor board reviews and reviews of previous relevant cases.
Export any report to an excel spreadsheet for further analysis, or to a PDF file to email to colleagues, or to print on paper.
Data is calculated once then stored to a server or an embedded database for multiple reads from thin clients for a responsive system.
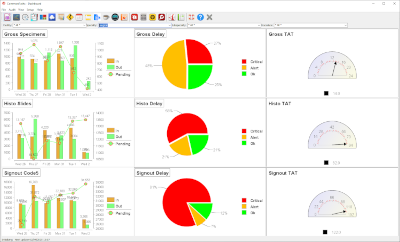
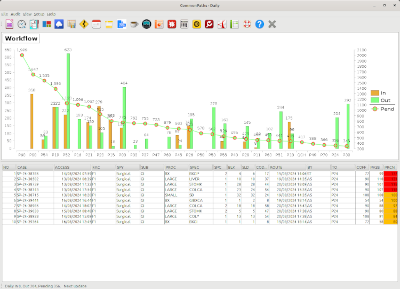
A business dashboard is a visual interface that provides a consolidated view of key performance indicators (KPIs) and metrics, enabling you to make informed, data-driven decisions across the 3 major steps of the workflow: grossing room, histology lab and signout.
Track your staffing requirement by the total number of full-time equivalents (FTE) and grouped by facilities, specialties, sub-specialties and pathologists during any time period in real-time.
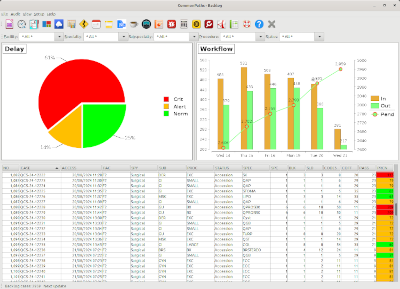
Cases are sorted by turn-around time and color coded in green, amber or red to highlight the backlog to the grossing room or histology lab. A dashboard is available tailored for the grossing room and another for the histology lab.
Cases assigned to pathologists are tracked prospectively in real-time based on complexity to facilitate a fair and equitable distribution of work within the department.
Track your daily assignments and compare your progress to your colleagues in real-time to encourage an open, fair and transparent environment.
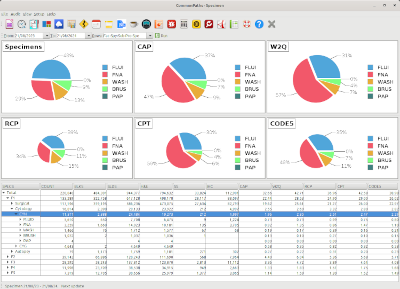
Track the volume and workload for each specimen type.
Track volume and workload trends by facilities, specialties, subspecialties and specimen type.
Review individual cases and specimens coding to ensure it is done correctly.
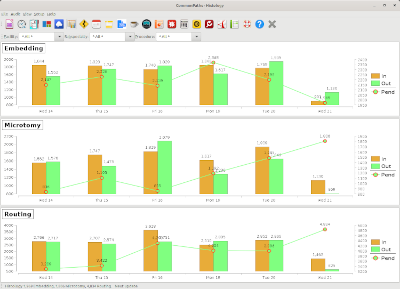
The number of blocks and slides flowing through the histology lab are tracked daily and hourly for each step to ensure adequate staffing and avoid bottle-necks.
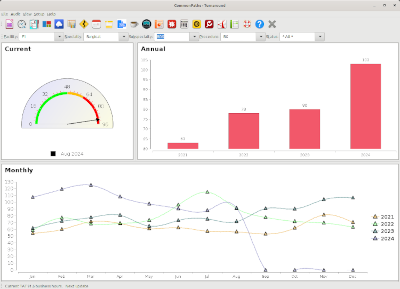
Track turnaround time for the current month and compare to previous months and years by business hours automatically adjusted for weekends and statutory holidays.
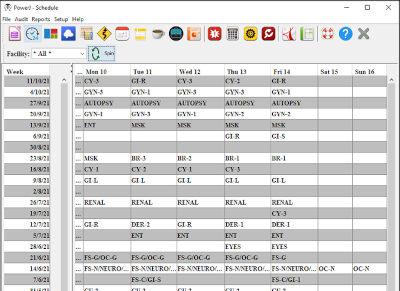
A living weekly schedule generated by artificial intelligence to optimize workflow and job satisfaction with a rotating view either by service or by staff.
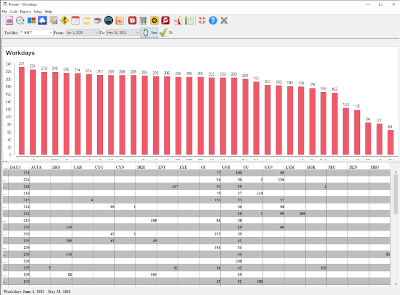
Track pathologists schedule by service days over any time period.
Track pathologists schedule by workload FTE over any time period.
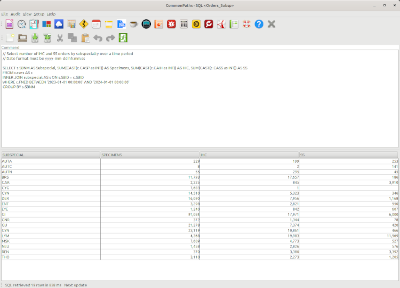
The SQL interface contains many additional custom reports that you can execute. You can also create your own reports if you are comfortable with the programming language, or I can do it for you for a small fee.