Histology
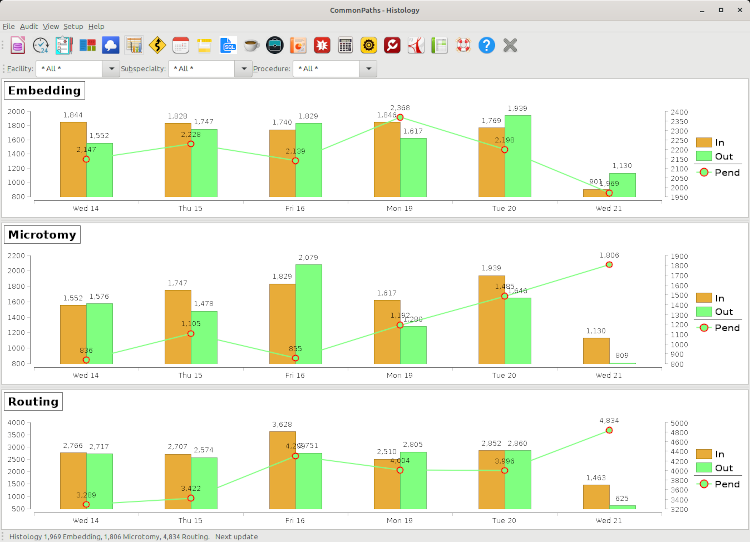
The histology dashboard consists of 3 charts showing the workflow of the three stations in histology for the last 6 workdays:
- Embedding: this chart displays the number of blocks received from the grossing room in the amber bar, the number of blocks embedded in the green bar, and the number of blocks pending in the line with red circles. The units of both Y-axis' are blocks, whereby the left-side Y-axis shows blocks received (in) and completed (out), while the right-side Y-axis shows the backlog blocks
- Microtomy: this chart displays the blocks received from the embedding stations in the amber bar, the number of blocks microtomed in the green bar, and the number of blocks pending in the line with red circles. The units of both Y-axis' are blocks, whereby the left-side Y-axis shows blocks received (in) and completed (out), while the right-side Y-axis shows the backlog blocks
- Routing: this chart displays the number of slides received from the microtomy in the amber bar, the number of routed slides in the green bar, and the number of slides pending in the line with red circles. The units of both Y-axis' are slides, whereby the left-side Y-axis shows slides ready for routing (in) and routed (out), while the right-side Y-axis shows the backlog slides
Filters toolbar
The second toolbar on top of the screen below the main toolbar and above the charts allows you to filter the data by facility, sub-specialty and procedure. By applying these filters, you can drill down from the big picture to the fine details of looking-up the backlog of breast case, or biopsy cases, or breast biopsy cases.