Distribution
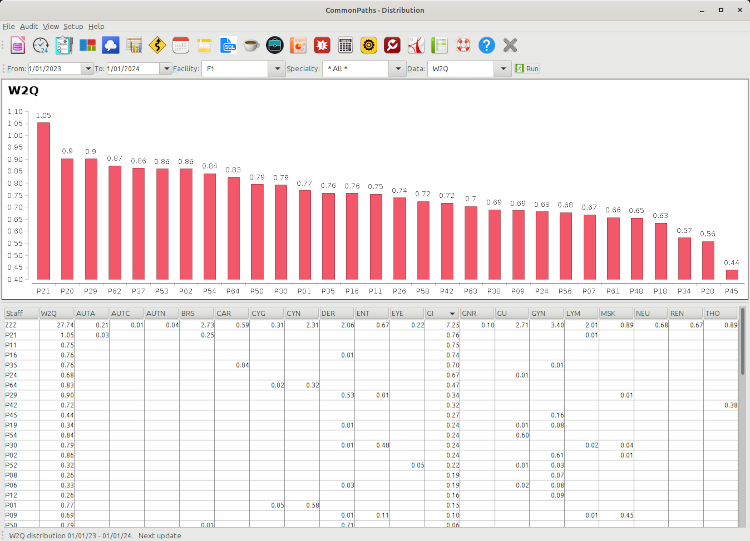
The distribution report shows the breakdown of the pathologists workload into the various subspecialties over a user-defined date range. The information is valuable to ensure the schedule is efficient and equitable. You can view the data by cases, specimens, blocks, slides, CAP-L4E, W2Q, RCP-UK, CPT-US and Code5. The default is by cases, which can be changed from the filter menu. It displays the data in a table and a bar chart sorted in descending order. The report can generate daily, weekly, monthly, quarterly and annual reports depending on the date that the cases were finalized.
The time is from midnight of the start date to midnight of the end range; therefore to collect data of an entire week, select a date from Monday to Monday. Similarly, for an annual report, set the date from Jan 1st to Jan 1st. To learn how to use a date filter, please refer to this tutorial page.
The last row of the table shows the totals, but to avoid issues with sorting, and to make it stay at the bottom (or top) of the table, it is labelled "ZZZ" for a quick fix. This will be fixed later.
Here's an example of generating the distribution report for the year 2023 by Code5:
- From the filter bar, select "From" date
- Change year to "2023"
- Change month to "January"
- Click day "1" to finish the selection, even if correctly displayed
- Select "To" date
- Change year to "2024"
- Change month to "January"
- Click day "1" to finish the selection, even if correctly displayed
- We now have the entire 2023 year, midnight to midnight
- Use the "Facility" filter if needed (default oall/off)
- Use the "Specialty" filter if needed (default oall/off)
- Set "Data" to Code5
- Press the "Run" button
- In a few seconds, the report is available to you!