Backlog
The backlog report shows pending cases in various stages of processing with color codes that indicate whether the pace of progression meets the standards set by the administration. You can filter which cases are included using the facility, specialty, sub-specialty, procedure and status in the filter bar. A case can have one of these status values:
- Accession: awaiting gross description
- Gross: Case has been grossed and awaiting embedding of blocks (if any) in the histology lab
- Embeded: Blocks have been embeded and awaiting microtomy of blocks (if any) in the histology lab
- Microtomy: Blocks have been cut into unstained slides and awaiting staining of H&E and routing to the responsible pathologist
- Routed: Histology is completed and the case has been assigned to the responsible pathologist and awaiting diagnosis
- Diagnosis: Diagnosis has been typed and awaiting release of the case by the pathologist (electronic signature)
- Final: you will not see this status as the case is immediately removed from the queue
CommonPaths has 2 dashboards designed specifically to meet the requirements of the grossing room and the histology lab. They enable the staff to automate case priority and avoid delays.
Filters toolbar
The second toolbar on top of the screen below the main toolbar and above the charts allows you to filter the data by facility, specialty, sub-specialty, procedure or status. The filters are cumulative, so you can select multiple filters at the same time.
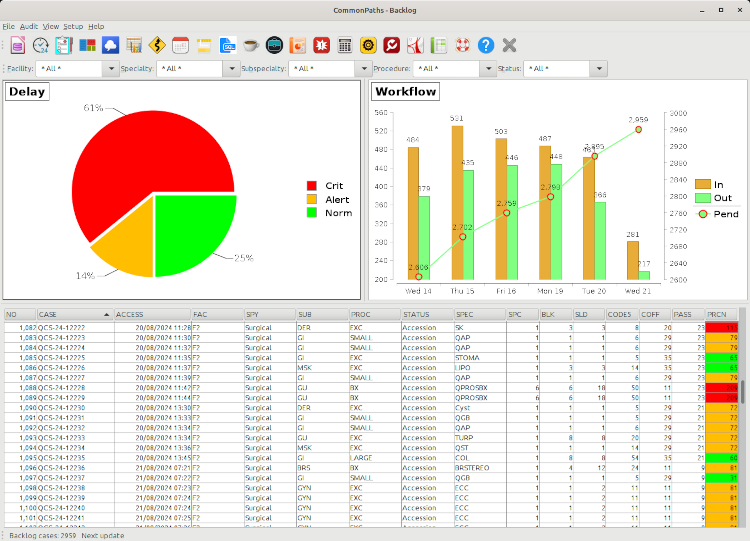
Pie chart
The pie chart to the left shows the breakdown of cases status into 3 cutoffs: delayed (red), within (green) and close (amber) to the alloted time. The alloted time for each case depends on its largest specimen and is different for biopsies (shortest) than radical resection specimens (longest)
Bars and line chart
The 2 bars and 1 line chart to the right shows the daily breakdown of cases received/in (amber bar), completed/out (green bar) and remaining/pending (green line with red circles) over the past week. The Y-axis to the left is for the bars (in/out), and the Y-axis to the right is for the line (pending)
Data Table
The table shows the case number, date received, facility, specialty, sub-specialty, procedure, status, main (largest) specimen description, number of specimens, number of blocks, number of slides, Code5 workload value, the cutoff time alloted to reach the current status, the time spent so far, and the percent of time (%) that has passed. The cutoff time and spent time are both calculated in business hours. The percentage (%) column of each case is tagged by a red background if the time passed since accession has exceeded the time alloted for the largest specimen. An amber background indicates the case has reached 70-99% of its alloted time, and a green background indicates 0-69% of the alloted time has passed. To learn how to manage a data table, please refer to this tutorial page