Tutorial
Main Screen
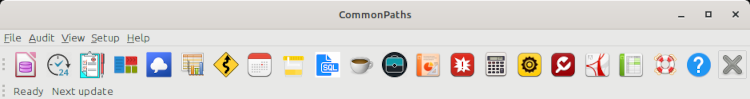
The main screen is a small bar that has an elastic property to free your desktop space, and occupy the smallest space when none of the reports is opened. It expands when a report panel is opened, then shrinks back to when the report is closed. It remembers its location and size, and the size of each report from one session to another, so you can change them once only to your preference. It has 3 components:
- The menu bar at the top to open the different reports with shortcuts (hotkeys) listed next to each report. To activate the menu use the mouse, press the alt key alone then use the arrows to scroll, or use the shortcut key
- The tool bar in the middle to access the most common reports by mouse clicks. If you hover the mouse over a toolbar button, a tooltip will popup describing the attached report
- The status bar at the bottom that displays important system messages and has a progress bar that turns on when the system is running a long time-consuming task like updating data
Warning: It is highly recommended not to close the application while the progress bar is active, as it likely cause data loss or database corruption. This is especially critical for the desktop version of the software.
Closing Reports
It is highly recommended to close reports when not being used, especially if you have many programs opened simultaneously. This will reduce memory usage significantly and stop automatic updates until you open the report again. To close a report without closing the application:
- Use the mouse to click on the last button in the toolbar with the large X image
- Use the shortcut key combination Ctrl-W
- From the menu bar by pressing “File” then “Close”
Tables
Most data are displayed in tables with column headers on top. Use the scroll-bars to the right and bottom to view additional data. You can also increase the window size by grabbing its edges or corners with the mouse.
If the data is wider than the column width, it is displayed partially with 3 dots ... at the end. You can adjust the column width by grabbing its header at the right edge with the mouse and sliding it left or right.
You can change the sorting order to any column data by clicking the column header with the mouse. A second click changes the sort order from ascending to descending, and a third click back to ascending order.
Treetables
Some reports use a treetable to display hierarchy data, totals and sub-totals, like workload and specimens reports. A treetable shows data with grand totals on top (root), followed by subtotals (nodes or branches), to finally individual items without children (leafs). The tree can be expanded or collapsed using the mouse button or the keyboard:
| Action | Description |
|---|---|
| Right arrow > or Plus Sign + | Expand the root or the selected node |
| Left Arrow < or Minus Sign - | Collapse the root or the selected node |
| Ctrl-Right Arrow Ctrl> or Ctrl-Plus Sign Ctrl+ | Expand root and all nodes |
| Ctrl-Left Arrow Ctrl< or Ctrl-Minus Sign Ctrl- | Collapse root and all nodes |
| Alt-Right Arrow Alt< or Alt-Plus Sign Alt+ | Expand all nodes under the selected node |
| Alt-Left Arrow Alt< or Alt-Minus Sign Alt- | Collapse all nodes under the selected node |
Filters

Most reports display a second toolbar below the main toolbar that contains one or several drop-down menus to restrict the data displayed to the selected item. Most reports will update immediately after making one selection, but those that make heavy calculations, like workload, will wait for you to set all the filters, then press the green “Go” button to refresh the report.
Data filters are cumulative, meaning you can select just breast biopsies from one facility. To remove a filter, select the top item labelled “* All *”.
Dates Filter
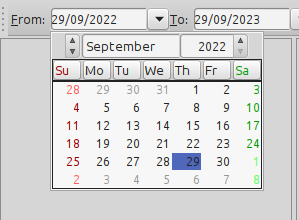
Some reports use a date range to generate daily, weekly, monthly, quarterly or annual reports depending on the date that the cases were finalized. You should always set the start date (from) before setting the end date (to).
The time is always from midnight of the start date to midnight of the end range; therefore to collect data of an entire week, select a date from Monday to Monday. Similarly, for an annual report, select a date from Jan 1 to Jan 1.
Warning: When editing a date with the widget, you must always end the selection by pressing the day of month, even if the display is correct. This will trigger an event that the date has been selected, otherwise, the changes will not take effect. Therefore, always change the year first, then the month, then the day. You can view the selected dates as interpreted by the application at the bottom statusbar.
Rows Filter
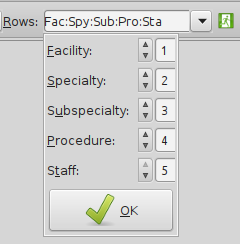
The reports that use treetables to display hierarchy data, like workload and specimens, can be customized by using the rows filter to specify the order of parents and children by the drop down menu above. The default is facility, specialty, sub-specialty, procedure, staff. To disable any node, set its order to 0. To raise a subtotal higher, lower its index.
For example, to change the hierarchy to staff, facility, specialty, sub-specialty, procedure, You only have to change staff from 5 to 1, and the others will alter their hierarchy automatically.
Another example, to change the hierarchy to specialty and facility only, start by setting staff to 0, next set procedure to 0, next set sub-specialty to 0, and finally set specialty to 1 (facility will move automatically to 2).
To reactivate disabled nodes, start from the bottom up. For example, to change the last example (2, 1, 0, 0, 0) back to the default (1, 2, 3, 4, 5), first set staff to 5, then set procedure to 4, then set sub-specialty to 3, and finally set specialty to 2 (facility will move automatically to 1)
Data Export

Most reports allow you to export the data to a portable document file (pdf) or a Microsoft Excel spreadsheet (xls). To export the data, press the “PDF” or “Excel” button in the toolbar, or use the menu item “File”. The data is exported in the same sort order selected in the report. The files are saved in the default sub-folder “data”, and the file name will the same as the report, but you can select a different location or different file name in the save window.
Business Hours
Turnaround time, cutoff time and spent time are all calculated in business hours to account for cases received late in the day or before a long weekend.
For example, if the histology laboratory business hours are from 6 am to 10 pm, and a case is received on Friday at 3 pm and signed out the next business day which happens to be a Tuesday after a long weekend at 1 pm, it will accumulate 7 hours on its accession date and 7 hours on its sign-out date, for a total of 14 business hours rather than 94 regular hours. If another case is received on Tuesday at 3 pm and signed out the next business day, Wednesday at 1 pm, it will also accumulate 7 hours on its accession date and 7 hours on its sign-out date, for the same total of 14 business hours rather than 22 regular hours
Context Help
To view the description of a report or get help on using the application or any of its reports, press the context-sensitive help button.