Forecast
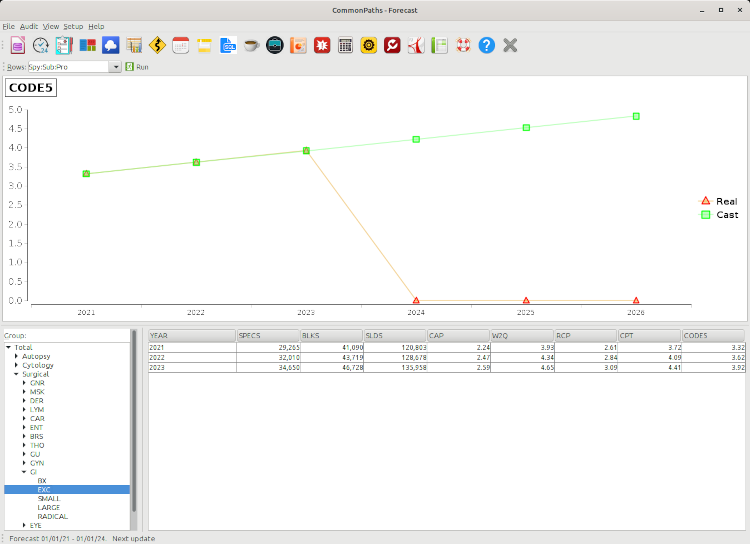
The forecast report shows the annual volume of each specimen from the years available in the system, and extrapolate the data to the next 3 years using the least-square regression analysis method. This report is valuable in tracking workload trends for various specimens and prepare for adequate staffing. For each year, the total number of specimens, blocks, slides, as well as the FTE for CAP-L4E, W2Q, RCP-UK, CPT-USA and Code5. The data is displayed in a 2-lines charts and a treetable.
The report hierarchy can be specified by the drop down menu at the top. The default is facility, specialty, subspecialty, procedure, specimen. To learn how to change the hierarchy, please refer to this tutorial page.
The chart displays the actual data (red line) and the extrapolated data (green line) of the selected node.
The treetable shows the totals on the top (root), followed by a breakdown hierarchy in the rows (branches), each containing the individual items (leaves). To learn how to use a treetable, please refer to this tutorial page.
Here's an example of generating the forecast report by specialty and sub-specialty only:
- Select "Rows"
- Set "Procedure" to 0
- Set "Facility" to 0
- By default, "Specialty" will become 1, "Sub-specialty" will become 2 and "Specimen" will become 3 (unless they have been modified previously from the default)
- Press the "Ok" button
- Press the "Run" button
- In a few seconds, the report is available to you!