Daily
The daily report gives each pathologist a snapshot of her/his workflow and workload for the current day.
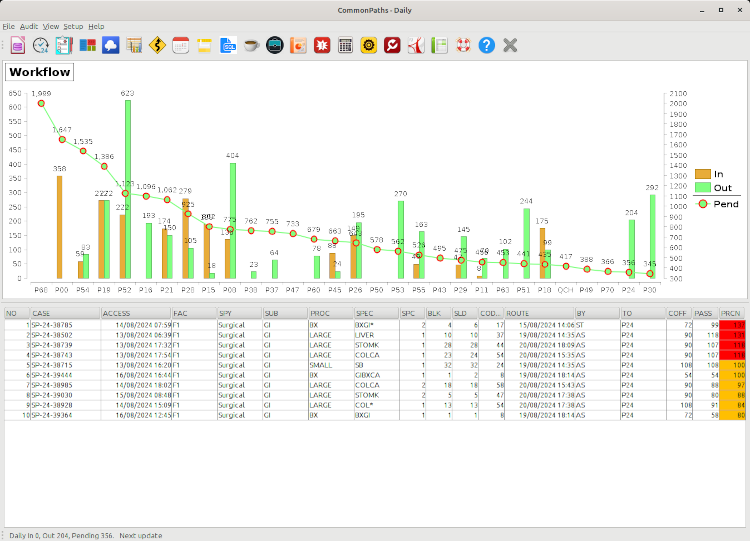
Data Table:
The table shows the details of pending cases assigned to the current pathologist. It includes the case number, date received, facility, specialty, subspecialty, procedure, main (or largest) specimen description, number of specimens, number of blocks, number of slides, Code5, date routed, time alloted, time spent so far calculated in business hours, and the percent of time (%) that has passed. The table is initially sorted by the % column, but you can change the sort order by clicking on the column header of your choice. To learn how to manipulate a table, please refer to this tutorial page
A case is tagged by a red background if the time passed since accession has exceeded the time alloted (turnaround time or TAT). Amber background indicates the case has reached 70-99% of its alloted time, and a green background indicates 0-69% of the alloted time has passed. The elapsed time is calculated in business hours.
Workflow Chart:
The bar and line chart at the top shows today's distribution of cases among all the pathologists by Code5. The units of both Y-axis' are minutes, where a full-day workload is equil to 360 minutes. The left-side Y-axis shows the new cases routed today in the amber bar (in), and the finalized cases are in the green bar (out). The right-side Y-axis shows the backlog (line with red circles) also in number of minutes required to complete the cases. The pathologists are sorted by their backlog volume.